
Participants in the Data Exploration Tool
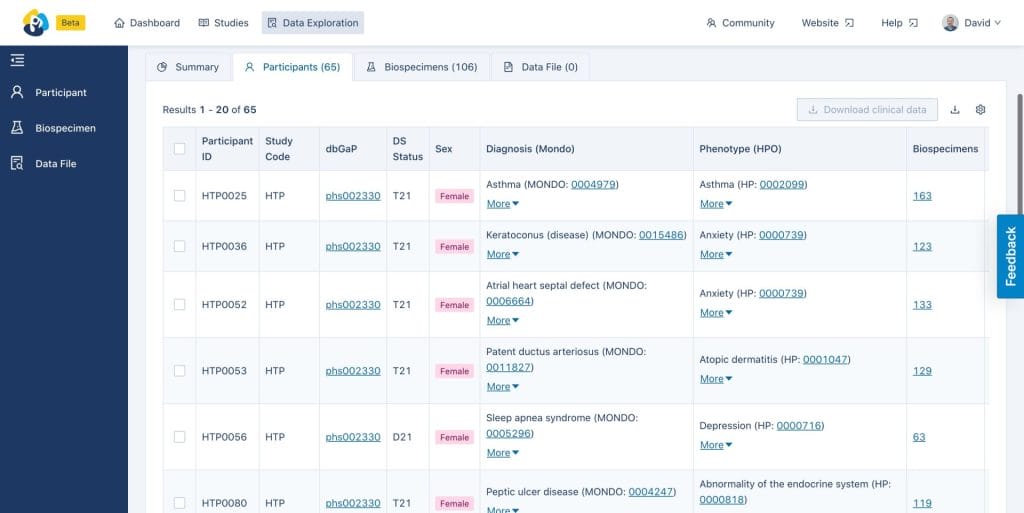
The Participants Tab provides information about the participants that were returned by the filters applied to the INCLUDE cohort in the Data Exploration Tool.
Users can access the Participants Tab by selecting it, between the Summary and Biospecimens Tabs in the Data Exploration Tool.
Adding or Removing Data Columns
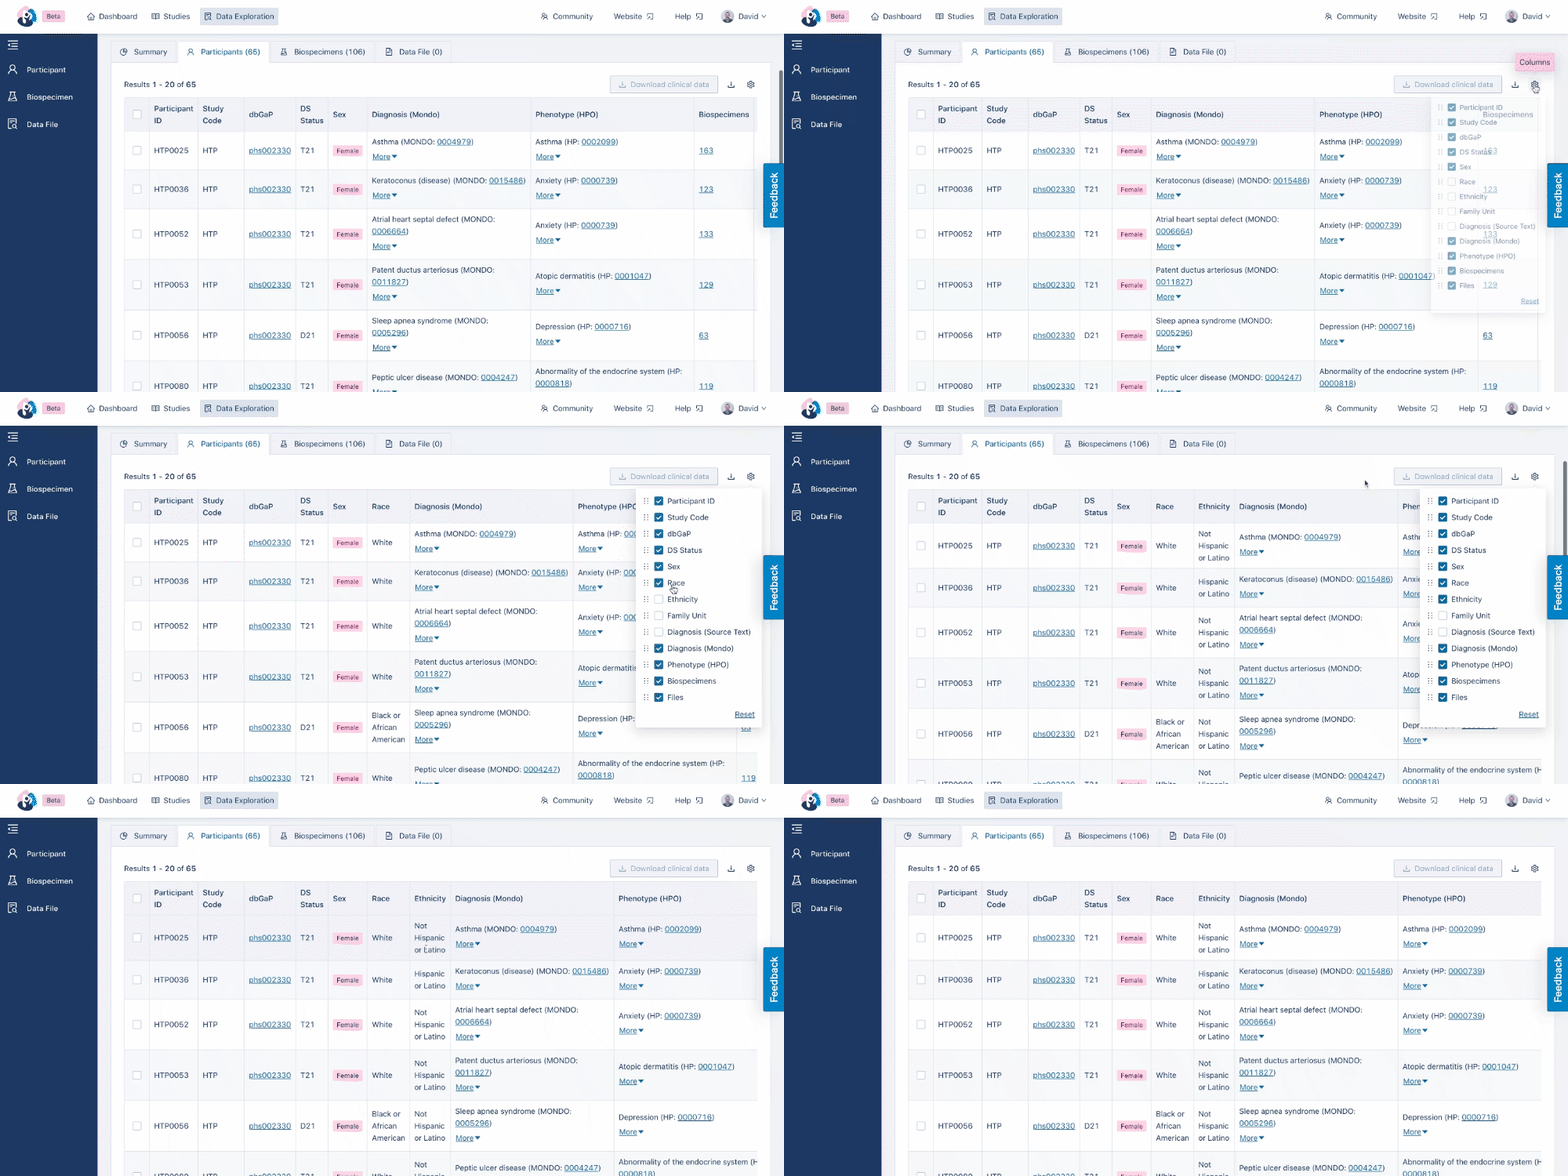
The columns in the Participants Tab provide additional information about the participants returned from the user’s query. 8 columns are displayed by default. Users can add or remove columns using the Gear icon in the top right of the tab.
Select a filter by choosing one from the right column. It will appear in the filter box in the center of the screen. You’ll notice that the number of participants will be updated to reflect this filter.
The default values for the Participants Tab are described in the table below.
| Column Title | Column Description |
|---|---|
| Participant ID | A unique identifier which describes a single participant in the INCLUDE Data Hub. |
| Study Code | A short code representing the INCLUDE Study that the participant is enrolled in. Studies are described further in the Studies Tool |
| dbGaP | If this participant’s study is in dbGaP, the phs ID for that study is displayed here with a link to apply for access. |
| DS Status | The Down syndrome diagnosis of this participant |
| Sex | The biological sex of this participant |
| Diagnosis (Mondo) | Any clinical diagnoses associated with the participant are shown here. These clinical diagnoses are harmonized using the Mondo Disease Ontology. |
| Phenotype (HPO) | Any clinical phenotypes associated with the participant are shown here. These clinical phenotypes are harmonized using the Human Phenotype Ontology. |
| Biospecimens | The number of biospecimens associated with this participant. Clicking the link in this column will apply a filter for just biospecimens from this participant and switch the Data Exploration Tool to the Biospecimen Tab. |
Downloading Clinical Data
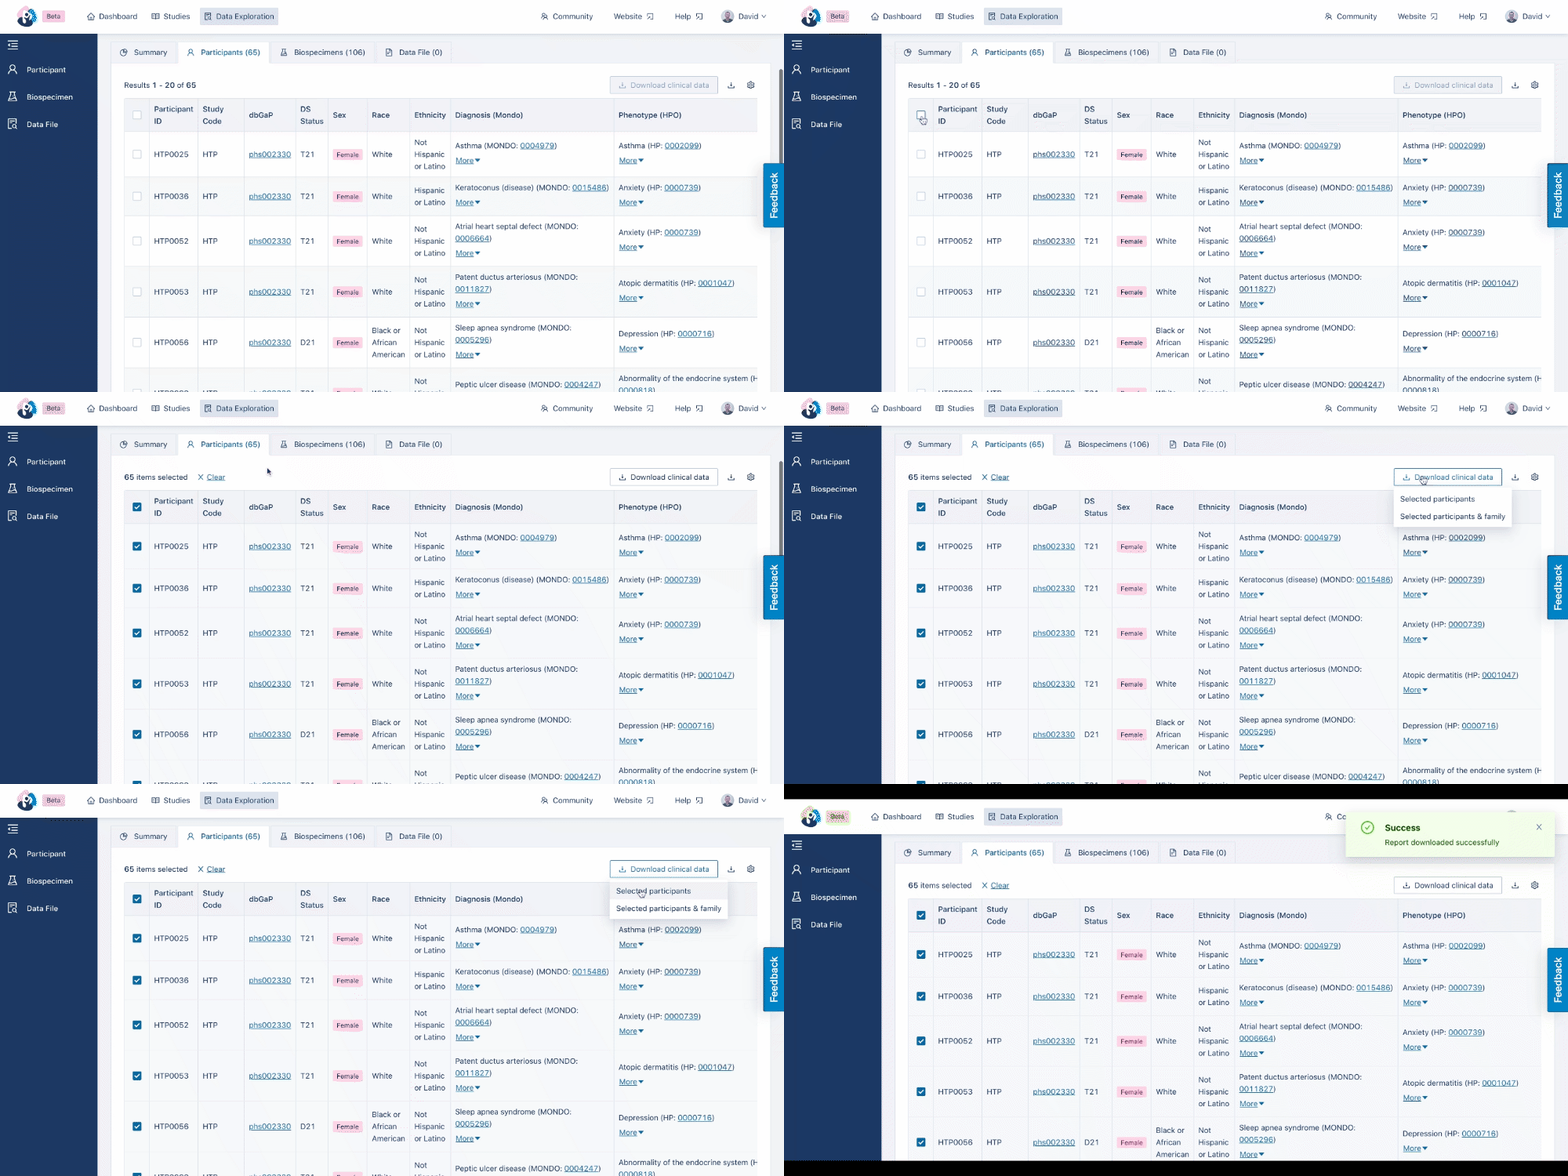
After selecting participants in the table, users can download the clinical data for those participants using the Download clinical data button. Clicking this button generates an Excel document with a comprehensive list of the participants’ phenotypes, diagnoses, and family relationships.
Users can select multiple pages of individuals or select the entire cohort by choosing it at the top of the table.